How much money do NU graduates make in their first year out of college?
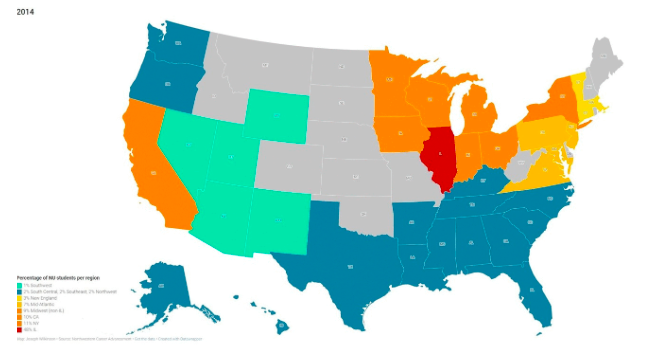
A 2014 map of Northwestern students per state. The state with the highest percentage of NU graduates is Illinois.
June 5, 2018
In its “Beyond Northwestern” reports, Northwestern Career Advancement has publicly released data on how much money Northwestern graduates make in their first year after college. The Daily charted the salaries from 2013 to 2017, grouping them by year, school and in order from highest to lowest.
The data are not all-encompassing. On average, they represent between 400 and 650 graduates per year, all of whom were employed full-time.
The number of students surveyed from each school was nearly proportional to individual schools’ populations. Weinberg College of Arts and Sciences and McCormick School of Engineering often had more than 100 students surveyed, while the Bienen School of Music rarely had more than 10 students represented. The School of Education and Social Policy, Medill School of Journalism and School of Communication each had at least 40 student responses included every year of the survey.
Overall, salaries have increased from 2013 to 2016, with a slight decrease in 2017.
Below, the data are grouped by school instead of by year. McCormick graduates consistently pulled in the most money in their first year out of school.
And the following information is ordered from the highest salaries to the lowest ones.
Additionally, The Daily compiled further NCA data — from the “Beyond Northwestern” reports — on where Northwestern graduates work in the U.S.
The state with the highest percentage of NU graduates is Illinois, but in the past five years, that number has not been high enough to create a majority.
In the following GIF, the 3 percent to 5 percent of students who were internationally based are not represented. The geographical designations are taken from NCA as well, and the years for each distribution are in the top left corner of the GIF. Click for an expanded view.
Email: [email protected]
Twitter: @joe_f_wilkinson