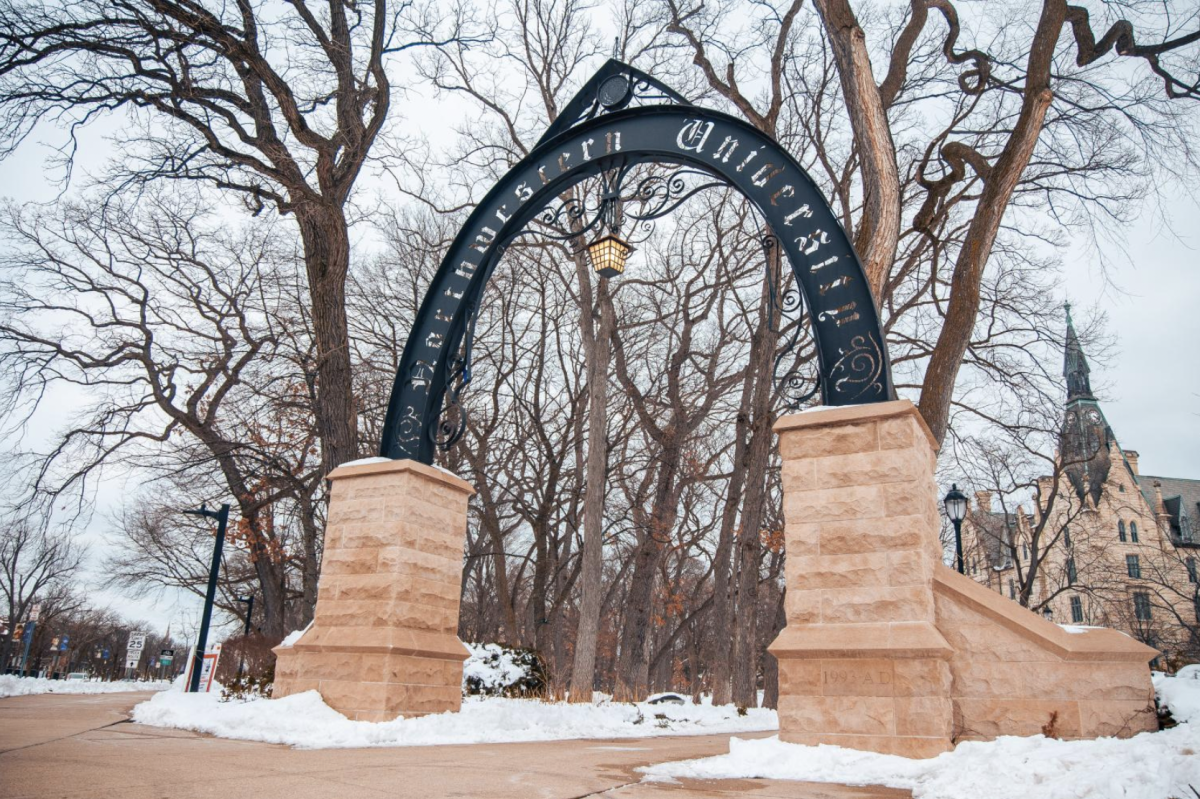
The Daily conducted its inaugural campus poll of undergraduate students two weeks ago, asking students about demographics, admissions, lifestyle, national politics and Northwestern issues.
In total, 1,135 students responded to the anonymous survey, which was open online to NU students for one week and advertised at three on-campus polling stations for three days. For reference, NU had 8,846 total undergraduate students in 2023-2024, according to the University’s Common Data Set report for that year. (The report for 2024-2025 has not been released yet.) About one in eight undergraduate students filled out the poll.
Here are some of the most notable results. You can view data on all the questions at our interactive page.
Third of students surveyed approve, disapprove of Schill’s job performance
The percent of students who “strongly approve” or “somewhat approve” of University President Michael Schill’s job performance was 32.0%, compared to the 33.8% of students who “strongly disapprove” or “somewhat disapprove.”
Excluding students who are new to campus this fall, however, Schill’s net approval is much lower. Of the students in their second year or above who are not new transfers, 31.8% approve and 42.0% disapprove, yielding a -10.2% net approval rating among returning students. Schill’s net approval steadily decreases as grade level increases, with first-years giving him a net approval of 19.7%, second-years 6.1%, third-years -17.1%, and fourth-years -24.9%.
Over twice as many students strongly disapprove (11.2%) as strongly approve (5.4%) of Schill’s performance, with 64% of the respondents who strongly disapprove being third- and fourth-year students. Schill’s approval was not markedly different when split up by school.
The Daily did not ask respondents to explain their rating of Schill in the poll, which consisted of only multiple-choice questions. However, there is a clear relationship between respondents’ rating of Schill and their approval rating for the pro-Palestinian encampment which occurred on Deering Meadow last spring. In general, students who approved of the encampment were less likely to approve of Schill.
Respondents were asked “Do you approve of the encampment on Deering Meadow last spring?” In total, 58.0% of all students responded that they “strongly approve” or “somewhat approve.” Of these students, half (49.8%) said they disapprove of Schill. In contrast, only 21.4% approve. For those who expressed disapproval toward the encampment — a much smaller group, totaling 20.1% of respondents — 54.5% approve and 17.9% disapprove of Schill.
This data suggests students’ stances on Schill are in opposition to their stances on the encampment. The trend is not universal, though — Schill’s disapproval rating begins to creep up again among students who “strongly disapprove” of the encampment. This may indicate that a small portion of the student body believes Schill was too accommodating toward the encampment.
Nevertheless, students strongly agreed with the University’s decision to negotiate with student demonstrators.
The Daily asked respondents, “Do you agree with University administration’s decision to strike a deal with student demonstrators last spring?” A clear majority of students — 60.6% — said they either “strongly” or “somewhat” agree. This trend held both among students who approve of the encampment and among those who “somewhat disapprove.”
The exception was students who “strongly disapprove” of the encampment, totaling 9.8% of students. Nearly half (46.8%) of them disapproved of the deal, with 27.5% strongly disapproving; 33.0% said they approved of the deal. Again, this suggests that a small portion of students — somewhere around 2.5-5% of respondents — think that the University’s response to the spring demonstrations was too lenient.
— Scott Hwang
42% of respondents have never had sex — while 22% have it regularly
Two out of every five Northwestern undergraduates reported never having had sex before, while about one in five (18.4%) say they have sex weekly and 3.1% daily.
The numbers were similar for men and women, with 21.5% of women and 19.9% of men reporting “weekly” or “daily” sex. (That means a greater total number of women are having sex, given that women occupied 58% of our poll respondents and 54% of the undergraduate student body as of 2023-24, according to the University’s Common Data Set for that year. The numbers are 35% and 46% respectively for men.)
It appears that non-binary or gender non-conforming students are having sex at a higher rate than both men and women, with 31% indicating “weekly” or “daily” activity — about 10 percentage points higher than the overall student body. We should note, though, that our sample size for these students is smaller, with only 54 respondents.
Of those who report having sex “weekly” or “daily,” about half identify as straight (47.4%). 22.6% identify as bisexual, 15.8% as gay or lesbian and 8.1% as queer. For comparison, 56.2% of the overall student body identifies as straight, 19.5% as bisexual, 9.2% as gay or lesbian and 7.1% as queer — suggesting that non-straight students are slightly more likely to have regular sex than their straight counterparts.
How does being in a relationship impact the frequency of sex among students? Out of the 729 respondents who said they were not in a relationship, only 5.1% said they had sex “weekly.” None reported having sex “daily.” In contrast, half of students in relationships — 47.1% — reported having sex “weekly” and an additional 9.6% reported having sex “daily.” 11.4% of students in relationships indicated that they “never” have sex, while 27.3% say they have sex “not regularly.”
Since relationship status seems to be indicative of sexual activity, let’s take a closer look into who in the student body is coupled up.
There’s a noticeable relationship between class year and relationship status, with younger students being more likely to be single. While 77.5% of first-years reported not being in a relationship, that number drops significantly to 56.2% among fourth-years. Regardless of the class year, however, a majority of students find themselves single at NU.
The Daily also asked students about their alcohol and drug consumption. About two in five students — 40.6% — said they drink weekly, while 32.2% drink “not regularly.” Less than one percent of students reported drinking every day, and 24.1% of students said they “never” drink.
The percentage of students who drink both “weekly” and “not regularly” increases by class year. Among first years, 31.2% drink “weekly,” 28.6% “not regularly” and 36.0% “never.” Among fourth years, 47.5% drink “weekly,” 38.0% “not regularly” and 12.7% “never.”
Drinking habits differed greatly among students involved in Greek life. For students involved, 69.6% drink “weekly,” 17.6% “not regularly” and 7.4% “never.” For students not involved, a much lower 36.1% drink “weekly” and 34.5% “not regularly,” while a much higher 26.6% “never” drink.
Of the recreational drugs The Daily asked about — marijuana, nicotine products, psychedelics, cocaine, opiates and nitrites — marijuana was the most commonly tried by far. Half of respondents — 49.6% — said they had tried it, compared to 27.1% having tried nicotine products, the next most commonly tried drug, which includes cigarettes and vapes. (Also, respondents did not need to indicate a response, so non-responses may be making these numbers artificially low.) None of the other drugs reached 10% of all respondents.
— Kota Suzuki and Scott Hwang
Student body overwhelmingly liberal, supports Harris
In light of the coming U.S. election in November, The Daily surveyed the undergraduate population on its political views.
The responses were, on the whole, highly uniform.
Seventy-nine percent of respondents identify as either “very liberal” or “somewhat liberal,” compared to only 6.6% who identify as “very conservative” or “somewhat conservative.” Around one in 10 students — 11.3% — identify as “moderate.” 91.7% of students who expressed some presidential voting preference said they would vote for Vice President Kamala Harris.
Most students also consider themselves to be politically engaged. Four out of five respondents — 80.2% — said they were either “somewhat political” or “very political,” with 25.7% being “very political.” These top-line numbers strongly suggest that the Northwestern undergraduate population is overwhelmingly liberal and broadly politically active.
College campuses already lean liberal, according to recent data. According to the Spring 2024 Harvard Youth Poll — which was conducted before President Joe Biden dropped out of the presidential race — Biden led former President Donald Trump by 23 percentage points among likely voters who are college students.
Nevertheless, The Daily’s poll suggests that NU students are very liberal even compared to other college students. Looking at respondents who say they are “very likely” or “likely” to vote — an admittedly imprecise proxy for likely voters — Harris leads Trump by 84 percentage points.
Will political engagement among NU students be reflected at the ballot box? Students say so. Over four out of every five of students from the U.S. — 81.3% — said they were “very likely” to vote in the November election, with an additional 10.5% saying they were “likely” to vote. Nine in 10 (89.4%) respondents from states considered to be swing states — Arizona, Georgia, Michigan, Nevada, North Carolina, Pennsylvania and Wisconsin — said they were “very likely” to vote, a number that rises to 95.5% when “likely” voters are added.
Only one in 20 (5.0%) students with a voting preference said they would vote for Trump. 1.7% of students said they would vote for Green Party candidate Jill Stein, while another 1.7% expressed support for other candidates. Biden, U.S. Sen. Mitt Romney (R-Utah), Cornel West and Robert F. Kennedy Jr. each had one supporter.
— Jillian Moore and Scott Hwang
First-years admitted ED less likely to receive financial aid compared to RD
Slightly more than half of first-year survey respondents (51.9%) were admitted in the Early Decision round, while 43.5% were admitted in the Regular Decision round. The remaining 4.5% were QuestBridge admits.
The Daily analyzed data on first-year respondents to highlight the statistical differences between students who were admitted ED and those who were admitted RD.
Students who were admitted in the ED round are more likely to identify as Asian — 41.6% — compared to the 28.9% of RD admits who identified as Asian. RD admits are more likely to identify as Hispanic (21.5% of RD and 12.4% of ED) and Black or African American (20% of RD and 6.2% of ED). There was no statistically significant difference between the proportion of white students in the ED and RD samples. ED admits are also less likely to be international students.
Of the first-years admitted ED, 38.5% said they receive financial aid from Northwestern, a much smaller proportion than the 55.6% of RD admits. RD admits were more likely to say the cost of attending college was a concern to them or their family. 37.8% of RD admits said it was a “significant concern” compared to 21.7% of ED admits.
About one in ten — 9.3% — of ED admits said they have a parent who attended NU for an undergraduate degree, with 9.9% having parents who attended for a graduate degree (some of these respondents may overlap). Only 1.5% of RD admits have a parent who was an NU undergraduate, and 3.0% have a parent who was an NU graduate student.
The sample considered in this section consists of only first-year respondents and is therefore smaller than the poll’s overall sample. The Daily used statistical testing to ensure that any differences between the samples of ED and RD students had a less than 10% probability of happening randomly before reporting them.
— Scott Hwang
Methodology
The survey was conducted between Oct. 5 and Oct. 11. The data was analyzed in Python and Google Sheets. The Daily did not reweight responses by any variable, preferring to explicitly highlight notable differences between subgroups of students rather than make implicit assumptions about what variables mark salient differences between groups.
This was not a random sample of the undergraduate population, and not all groups are well represented in the data. For example, only 13 varsity athletes filled out the survey. Only 35% of respondents identified as men, while the University’s 2023-2024 Common Data Set lists men as 46% of the undergraduate population. (The University also identifies a much smaller proportion of students as having identities outside the gender binary.)
By aggregating over a sample size of 1,134 (The Daily removed one response it deemed disingenuous), the probability of random fluctuations in the data is small. However, all polling is subject to sampling biases, which may systematically skew the results in one direction. While The Daily attempted to advertise a wide variety of poll topics to draw respondents, students with strong views on certain questions may have been more likely to respond. Additionally, breaking up response data into smaller samples based on demographic data will lead to a higher probability of random fluctuation. This is why The Daily omits some demographics in some of its graphics. For example, students in their fifth year and later are not shown in graphics that divide the responses by grade level.
As part of the data cleaning process, some write-in responses were aggregated into existing or new categories. This was done for clarity of presentation. The Daily does not publish poll data at the level of individual responses.


