Men’s Basketball: What statistical analysis tells us about next season
May 4, 2015
Men’s Basketball
There’s already buzz surrounding Northwestern men’s basketball’s 2015-2016 season, and with good reason.
The Wildcats’ losses coming off of last season are minimal: guard Dave Sobolewski, a holdover from the Bill Carmody era who never found a home in coach Chris Collins’ system; JerShon Cobb, an effective but oft-injured wing player; and Jeremiah Kreisberg, a graduate transfer who lost his job as backup center down the stretch.
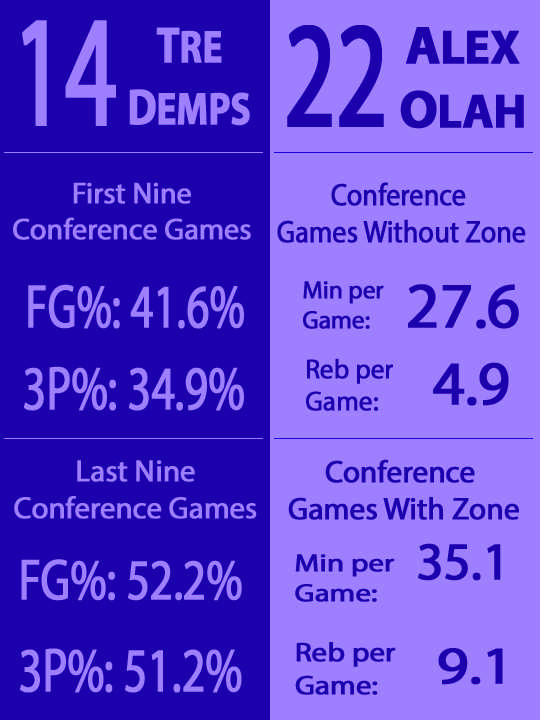
And the potential for improvement is obvious. Guard Tre Demps and center Alex Olah — the team’s two leading scorers last year — both return for their senior seasons. That pair is supported by a bumper crop of talented sophomores-to-be, including guard Bryant McIntosh and forward Vic Law, as well as exciting newcomer forward Aaron Falzon.
Hope springs eternal, but none of it can be realized until the next season tips off in November. In the intervening months, advanced statistical analysis provides some early insight into how the team will fare.
The development of Tre Demps
To the casual observer, Demps was on fire at the end his junior season. The shooting guard seemed electrified during NU’s late surge and capped his year with a 20-point performance against Michigan, when he twice hit a game-tying 3-pointer to extend the contest.
Given Demps’ career arc, the uptick in productivity makes a lot of sense: His freshman year he was a role player in the rotation, his sophomore year he became the undisputed sixth-man, and his junior year he stepped into the role of full-time starter.
The stats follow that narrative, as Demps’ offensive rating — an estimate of how many points he produces per 100 possessions — has steadily climbed from 95.7 to 100.7 to 104.1 over the past three seasons. He also posted a career-high player efficiency rating — a general measure of everything a player contributes on the court — in 2014-15.
And as expected, all of Demps’ traditional stats — points, rebounds, assists and shooting percentage — have also been climbing for the past three years. But what’s most interesting about his junior campaign is the split between his full-season statistics and his conference-only statistics.
For the first time in his career, the shooting guard posted a higher effective field goal percentage — a combined shooting statistic that accounts for the greater value of 3-pointers — in Big Ten play than he did overall. In other words, Demps became a more efficient shooter later in the season against a higher level of competition.
For a player often derided for poor shot selection, this is a big and potentially very important jump. But looking ahead to next season, it needs to be determined if Demps actually got better as the season went on or was just riding a particularly hot hand in February and March.
His conference numbers can be bifurcated into two samples — the first nine games and the second nine games — which can then be compared against each other to determine if any difference is statistically significant or just the result of random chance.
At a 90 percent level of confidence, Demps was indeed a significantly better shooter overall and from long range during the second half of the conference schedule than during the first. In other words, there’s an over 90 percent chance Demps’ hot streak was actual improvement, and a minimal chance it was random variance.
The best part about Demps’ stats is that he took an equal number of 3-pointers, 43, during the first and second halves, making the two excellent for comparison. The idea that Demps actually became a more efficient shooter is big, and it means his 2015-16 stats can be projected to improve on his 2014-15 line.
2-3 or not 2-3?
Demps may have had the steadily improving hand, but the greatest catalyst for NU’s late-season improvement was likely the adoption of a 2-3 zone defense. Before the zone, the Cats were 1-10 in conference play. After they switched, they went 5-2.
Of course, such a simple analysis belies the complexity of basketball, but on the surface the zone certainly seems to have helped. With defensive centerpiece Olah returning for his senior season, the question facing Collins is whether to continue using the zone.
The best way to determine the effectiveness of the zone is to look at NU’s opposing points per possession in each of its games, and then compare that to each opponent’s season average points per possession. If the zone was effective, there should be a more negative difference among zone games than among other conference games.
Sample size is an issue here because the Cats only played seven games using the zone, but based on the available data, the zone defense isn’t discernibly better based on points per possession allowed. The average difference in conference, non-zone games was 0.11 points per possession and the difference in conference zone games was a smaller 0.04 points per possession, but the gap between those numbers is more likely due to random chance or quality of opponent than the effectiveness of the defense.
The zone doesn’t make the defense as a whole better, but it may still be a boon for Olah. The 270-pound center saves a considerable amount of energy parked under the basket and not out on the perimeter dealing with pick-and-rolls, and it follows that his stats would be better as a result.
And the data indicates Olah plays significantly more minutes when the team is playing a zone and also pulls down a significantly greater number of rebounds, even when controlling for the additional playing time.
The zone doesn’t definitively help the NU defense but it doesn’t definitively hurt it either, and the added benefit for the Cats’ big man may be worth sticking with the defensive set.
Will Northwestern make the NCAA Tournament next year?
The Cats are definitely improving, and next year will probably be their best chance since the 2011-12 run. It’s difficult to predict the outcome of an entire season, but some insight can be gleaned from NU’s average point differential.
Points scored and points allowed — and the scoring margin, the difference between them — are actually good predictors of win percentage through a formula known as Pythagorean Win-Loss. Because of that, scoring margin can be used as a proxy for making the NCAA Tournament.
The Cats averaged a scoring margin of -1.1 points per game last season. Maryland, the lowest-ranking team in scoring margin in the Big Ten that qualified for the NCAA Tournament, averaged a difference of 5.7 points per game.
Using the Terrapins’ mark as the minimum cutoff, NU would need to jump up 6.8 points per game next season in order to make the tournament field. It’s possible, especially given that it’s very difficult to project the Cats’ exact degree of improvement, but it’s very unlikely.
Out of 351 Division I schools, just 30 made an equal or greater jump from 2013-14 to 2014-15. Of those 30, four made the NCAA Tournament and six made the lesser NIT. Of the four that made the tournament, just two were “Power Five” conference schools: Kentucky and Notre Dame.
Kentucky can be removed as an obvious outlier. The team was already talented enough in 2013-14 to make a run to the national championship game, and then reloaded in 2014-15 in a way only Kentucky can. NU clearly lacks the same recruiting base.
That leaves Notre Dame. On the surface, the case of the Fighting Irish should actually give Cats’ fans some hope. Notre Dame’s 2013-14 record — 15-17 overall and 6-12 in conference — is identical to NU’s 2014-15 mark, and the Fighting Irish are also led by a Mike Krzyzewski acolyte in Mike Brey.
But the Cats are missing Jerian Grant. The Notre Dame guard was the best player on the nation’s second-most efficient offense, averaging 16.5 points and 6.7 assists per game, en route to be considered for every major individual award.
NU also doesn’t have anyone like Pat Connaughton, a versatile wing who swallowed boards — averaging 7.4 rebounds per game in 2014-15 — as well as he shot 3s, making 42.3 percent from beyond the arc.
It’s possible for McIntosh and Law to develop into players of a similar caliber, but it’s very unlikely. The Cats should see increased production out of those two, as they should with Demps and Olah, but it probably won’t be enough to cover that 6.8 point scoring margin gap.
One out of 65 power conference teams isn’t very good odds, and that’s a dubious “one” given that Notre Dame had even better circumstances than NU. Next season will be fun to watch and should be another step in the right direction for the program, just don’t expect Collins and his squad to go dancing — yet.
Correction: A previous version of the graphic misstated the number of minutes per conference game that Alex Olah played last season without zone defense. He played 27.6 minutes per game. The Daily regrets the error.
Email: [email protected]
Twitter: @BobbyPillote