
Sometimes events just happen out of luck. Sometimes they happen for a reason. But can statistics take luck out of the equation and tell you who is more likely to win a given game? That’s what Professor David Smith and I tried to do leading up to this Saturday’s match-up between Northwestern and Ohio State.
We compiled a list of data from teams that have hosted ESPN’s “College GameDay” at home since 2010. We did not include any “GameDay” events that were at a neutral site (such as NU’s game against Illinois at Wrigley Field). The data we collected includes passing and rushing yards from that particular game for both teams as well as each team’s season averages. We also factored in turnovers and each team’s ranking coming into that particular game to determine whether the game was an upset.
To answer our question, we used a statistical procedure called logistic regression, in which we predicted the binary outcome of win/lose and upset/non-upset. An upset was defined as any win by the lower ranked team.
Virginia Van Keuren/The Daily Northwestern
Let’s analyze some of the data that we calculated:
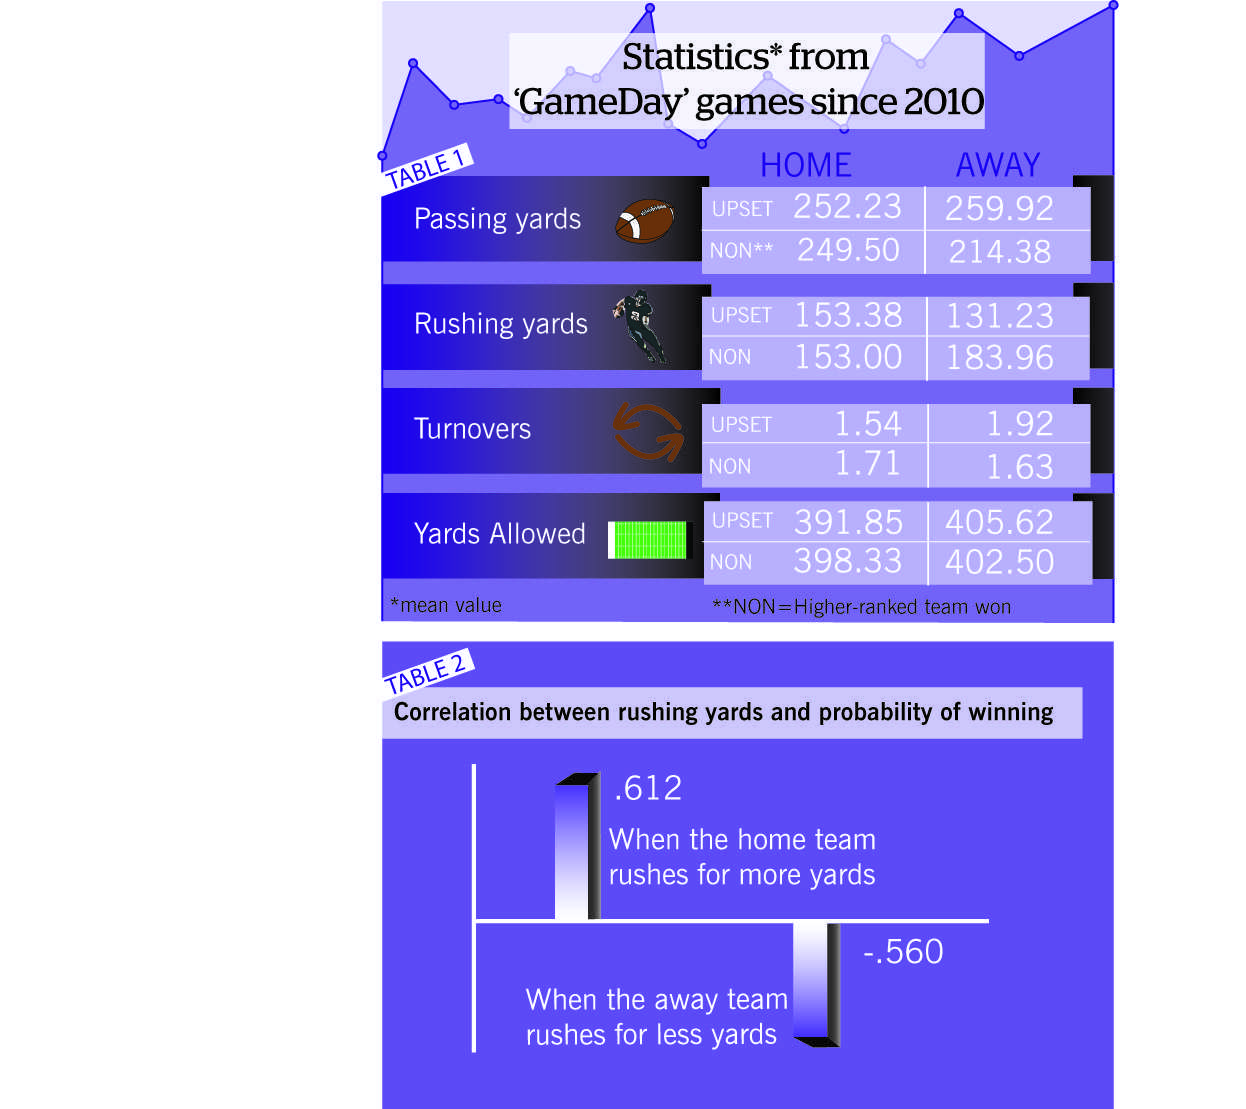
The chart above gives some more interesting statistics. We were able to calculate the mean for all the categories we entered into the formula. For these charts, “away” and “opp” are the same team. “Home” represents the home team that hosted “GameDay.” One of the noticeable differences between non-upset and upset results is in the away team rushing yards section. Away teams who were upset rushed for significantly fewer yards — 52 — than they did when they won. Let’s take a look at the next chart.
Here’s where we start to get a little more clarity on what might be a telling statistic in terms of deciding who wins. Let’s take a look at some correlations. In case you’ve never taken a statistics class, a correlation is a number that describes the relationship between two variables. So if we were to see a positive correlation between two variables, that would mean that if one variable increases the other does, as well.
In the first chart, we see the strongest positive correlation of .612 for home rushing yards to winning the game. In comparison, the away teams had a negative correlation of -.56 when they lost the game.
So what does this all mean? Essentially, rushing yards is the best predictor for determining the winner for “GameDay” matchups. Is there a magic number the Wildcats need to reach to beat the Buckeyes? Not necessarily. Currently the Buckeyes have the edge over the Cats in season average rushing yards, leading 287.2 to 249.5. But if NU is able to outgain OSU on the ground, there’s a good chance the Cats could pull off the upset on Saturday.
Quick hits
- Junior quarterback Braxton Miller has only played in two full games this year but has one extremely odd stat line. In the second half of games this year, Miller only has 42 yards passing, as opposed to 364 in the first half.
- OSU has never trailed in a game this year.
- The Buckeyes are outscoring opponents 116-21 in the first quarter in 2013.
- NU enters Saturday scoring at least 30 points in a school-record six consecutive games.
— John Paschall